
Dynamics CRM – Google Charts Mashup
By Joe Gill
Published On 26th July 2016
The combination of HTML Web Resources, Web API and Javascript libraries in Dynamics CRM allows you extensively customize the user interface. Here I am going to show how you can create a mashup of these technologies to show a custom appointments timeline chart on the account form. The out of the box charts are somewhat limited In Dynamics CRM however Google Charts has a vast array of charts which are free to use so I will use their timeline chart for this demo.

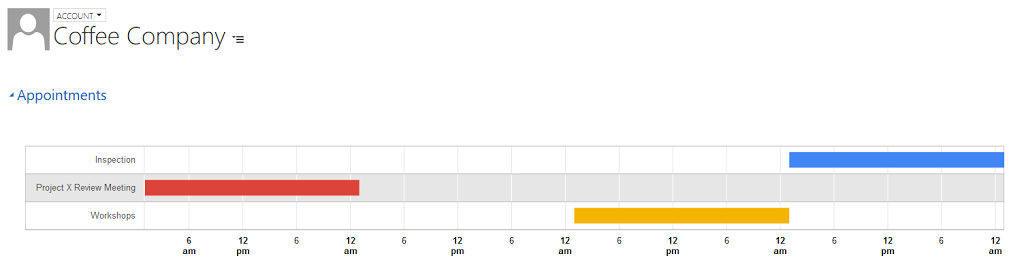
To accomplish this I created a HTML web resource which I added to the account form. Once it loads it runs JavaScript that does the following
- Get the ID of the current account record
- Web API call to get the appointments that reference the account id
- Populate the Google Chart datatable with the Json returned
- Call the Draw method to Render the chart
The code is below and you can see it references the Goggle Charts JavaScript libraries.
<html>
<body style="word-wrap: break-word;">
    <script src="ClientGlobalContext.js.aspx" type="text/javascript"></script>
    <script src="//ajax.googleapis.com/ajax/libs/jquery/1.11.1/jquery.min.js"></script>
    <script src="https://www.google.com/jsapi"></script>
    <script src="https://www.gstatic.com/charts/loader.js" type="text/javascript"></script>
    <div id="chart" style="width: 100%"></div>
  <script>
        $(document).ready(function () {
            google.load('visualization', '1', { packages: ['timeline'], callback: drawAppointments });
        });

        var dataTable;
        var chart;

        function drawAppointnments() {
            var container = document.getElementById('timeline');
            chart = new google.visualization.Timeline(container);
            dataTable = new google.visualization.DataTable();
            dataTable.addColumn({ type: 'string', id: 'Subject' });
            dataTable.addColumn({ type: 'date', id: 'Start' });
            dataTable.addColumn({ type: 'date', id: 'End' });

            getAppointments();
        }

        function getAppointments() {
            var id = parent.Xrm.Page.data.entity.getId().replace('{', '(').replace('}', ')');;

            var req = new XMLHttpRequest();
            req.open("GET", Xrm.Page.context.getClientUrl() + "/api/data/v8.0/appointments?$select=scheduledend,scheduledstart,subject&$filter=_regardingobjectid_value eq" + id, true);
            req.setRequestHeader("OData-MaxVersion", "4.0");
            req.setRequestHeader("OData-Version", "4.0");
            req.setRequestHeader("Accept", "application/json");
            req.setRequestHeader("Content-Type", "application/json; charset=utf-8");
            req.setRequestHeader("Prefer", "odata.include-annotations="OData.Community.Display.V1.FormattedValue"");
            req.onreadystatechange = function () {
                if (this.readyState === 4) {
                    req.onreadystatechange = null;
                    if (this.status === 200) {
                        var results = JSON.parse(this.response);
                        for (var i = 0; i < results.value.length; i++) {
                            dataTable.addRows([
                                [results.value[i]["subject"], new Date(results.value[i]["scheduledstart"]), new Date(results.value[i]["scheduledend"])]
                            ]);
                        }

                        chart.draw(dataTable);
                    }
                    else {
                        alert(this.statusText);
                    }
                }
            };
            req.send();
        }

    </script>
    <div id="timeline" style="height: 200px;"></div>
</body>
</html>